


A useful nonprofit board dashboard gives directors a clear view of mission progress without asking them to interpret every operational detail. It should answer a few questions quickly: Are the right priorities moving? Which outcomes are changing? What is off track? What decisions or support does leadership need?
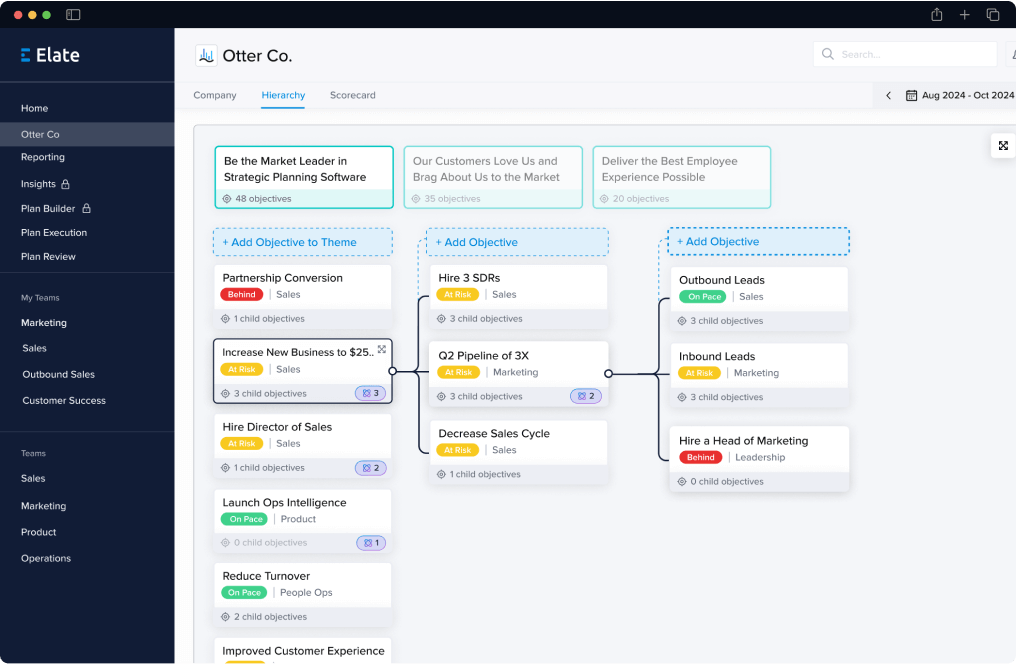
Elate helps nonprofit teams turn strategic priorities, owners, outcome updates, risks, and board-ready reporting into a repeatable operating rhythm. The dashboard is not the whole system. It is the governance view that comes out of a healthier cadence underneath it.
What a nonprofit board dashboard should do
The goal is not to give the board a live data warehouse. The goal is to give directors a consistent, credible view of progress so they can govern well, ask better questions, and support the executive team.
- Show the strategic priorities. Start with the priorities the board has already approved, not every active project.
- Summarize status clearly. Use simple status language so the board can see what is on track, at risk, or off track.
- Pair outcomes with narrative. Metrics matter, but they need context. Explain what changed, why it changed, and what the team is doing next.
- Surface risks and blockers. A board dashboard should make the hardest conversations easier to see, not easier to avoid.
- Name owners and next steps. Directors should know who is accountable for follow-up, even if they do not need task-level detail.
- Separate board decisions from operating updates. If leadership needs input, approval, or support, make that ask explicit.
A practical nonprofit board dashboard structure
Most nonprofit boards need a concise view first, with detail available only when needed. A practical structure is:
- Executive summary: three to five bullets on what changed since the last meeting.
- Strategic priority snapshot: status, owner, key outcome, and narrative update for each priority.
- Outcome and KPI view: a small set of board-level measures, not every supporting metric.
- Risk and blocker list: the items most likely to affect mission execution, funding, staffing, compliance, or delivery.
- Leadership asks: decisions, approvals, introductions, advocacy, or resources needed from the board.
- Appendix: program, site, grant, or department detail for directors who need more context.
What not to put in the board dashboard
A board dashboard loses usefulness when it becomes a dumping ground. Avoid:
- every metric from every program or site
- task-level project updates that belong with managers
- raw spreadsheet exports without narrative
- BI screenshots with no owner or next action
- vanity metrics that do not change decisions
- unfiltered internal commentary that has not been reviewed for board consumption
The dashboard should help the board see the operating story. It should not force directors to rebuild that story themselves.
Where Elate fits
Elate is useful when the issue is not a lack of plans or data, but a lack of connected ownership, update cadence, outcome context, and board-ready reporting. Nonprofits often have Teams, SharePoint, Excel, BI, CRM, finance, grant, and program systems already in place. Those systems can stay where they are.
Elate works as the mission execution layer that connects selected priorities, owners, updates, KPI context, risks, and reporting. That makes it easier to prepare board and funder-ready views without chasing every update by email or rebuilding the same deck each cycle.
Best fit and not the best fit
Best fit: Elate is a strong fit for multi-program or multi-site nonprofits that already have a strategic plan and need a repeatable way to review progress, collect updates, prepare board or funder reports, and keep ownership visible.
Not the best fit: Elate is not meant to replace grant management software, a CRM, a finance system, a BI dashboard, or task-level project management. It works best when those tools remain in place and leadership needs a clearer operating rhythm above them.
Questions to ask before building the dashboard
- What decisions should the board be better prepared to make?
- Which strategic priorities need board-level visibility?
- Which outcomes or KPIs are meaningful enough to review every cycle?
- Who owns each update before it reaches the board?
- Which risks need to be escalated early?
- What detail belongs in the appendix instead of the main dashboard?
Related resources
- Best nonprofit strategic planning software
- Nonprofit strategic planning software
- Nonprofit board report template
- Grant reporting for nonprofits
- Nonprofit strategic planning process
- Explore the Elate platform
- Request a product demo
FAQ
What should a nonprofit board dashboard include?
A nonprofit board dashboard should include strategic priorities, status, selected outcomes or KPIs, narrative context, risks, owner updates, and leadership asks. It should be concise enough for board review but structured enough to support good governance.
How is a board dashboard different from a BI dashboard?
A BI dashboard usually shows data. A board dashboard should connect data to strategy, ownership, narrative, risk, and decisions. The board needs the operating story, not only the numbers.
How often should a nonprofit board dashboard be updated?
Most nonprofits should align the dashboard to the board or committee cadence. Monthly executive review and quarterly board reporting is common, but the right cadence depends on the organization, funding cycle, and governance calendar.
Can Elate help with nonprofit board reporting?
Yes. Elate helps nonprofit teams connect priorities, owners, outcome updates, risks, and reporting so board-ready updates can be prepared from the same operating rhythm used to manage the plan.