


Quick answer: Nonprofits should measure strategic plan progress with a focused mix of outcome metrics, program delivery metrics, financial and funding metrics, capacity metrics, risk or compliance metrics, and execution metrics. The right set shows whether the strategy is moving mission outcomes, not just whether teams are busy.
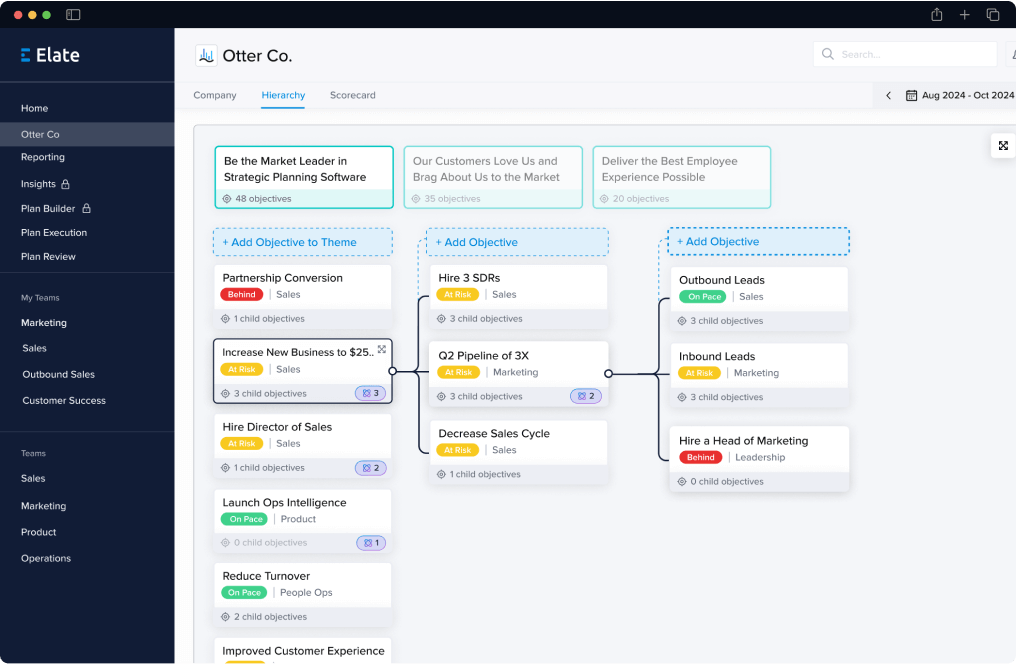
Where Elate fits: Elate helps nonprofits connect strategic plan metrics to priorities, initiatives, owners, and narrative updates. Metrics stay useful because they sit next to the work and the people responsible for moving them.
Use this page if: your board, executive team, funders, or program leaders are asking for clearer evidence of strategic plan progress.
Who this is for: nonprofit leaders, strategy and operations teams, program leaders, finance and grants teams, data teams, and board liaisons responsible for strategic plan reporting.
Best next step: Use this with the Nonprofit Board Report Template, Grant Reporting for Nonprofits, and Nonprofit Operating Rhythm.
The goal is not more metrics
Most nonprofits already track a lot of information. The challenge is choosing the few metrics that explain whether the strategic plan is working. A good strategic plan metric set should be small enough to review, credible enough to trust, and connected enough to guide action.
Metric categories nonprofits should use
1. Mission outcome metrics
These show whether the organization is advancing its core mission. Examples include client outcomes, education or employment outcomes, housing stability, health outcomes, community reach, or other mission-specific results.
2. Program delivery metrics
These show whether programs are reaching the intended population and delivering services effectively. Examples include people served, service volume, completion rates, wait time, referral conversion, case closure, and program participation.
3. Financial and funding metrics
These show whether the plan is financially sustainable. Examples include revenue mix, unrestricted funding, grant performance, budget variance, cost per outcome, and funding tied to strategic initiatives.
4. Capacity metrics
These show whether the organization has the staffing and operating capacity to execute the plan. Examples include staffing levels, vacancy rate, turnover, volunteer capacity, training completion, and workload indicators.
5. Risk and compliance metrics
These show whether risk is being managed before it affects mission delivery. Examples include missed reporting deadlines, compliance findings, audit issues, funder deliverables at risk, or critical operational dependencies.
6. Execution metrics
These show whether the plan is actually moving. Examples include percentage of initiatives on track, overdue updates, milestones completed, blockers open, decisions needed, and priorities with current owner updates.
How to choose the right strategic plan metrics
- Start with the board-approved priorities. Every metric should connect to something the organization has committed to.
- Separate outcome metrics from activity metrics. Activity shows effort. Outcomes show whether the effort is working.
- Assign an owner to every metric. A metric without an owner creates interpretation work later.
- Define the source and cadence. Know where the metric comes from, how often it updates, and how current it is.
- Add narrative context. Every important metric should answer what changed, why it changed, and what action follows.
- Limit what goes to the board. The board should see strategic indicators and exceptions, not every program statistic.
Example strategic plan metric set
A balanced nonprofit scorecard might include:
- Mission outcome: percentage of participants achieving target outcome.
- Program delivery: number of clients served against annual goal.
- Financial health: unrestricted revenue or budget variance.
- Funder commitment: percentage of grant deliverables on track.
- Capacity: staff vacancy rate or caseload load per staff member.
- Execution: percentage of strategic initiatives with current updates.
- Risk: number of at-risk initiatives needing leadership action.
KPI vs supporting metric
A KPI is a metric leadership uses to judge strategic progress. A supporting metric helps explain the KPI. For example, client stability may be the KPI, while attendance, case notes, outreach attempts, and referral activity may be supporting metrics.
This distinction matters for board reporting. Boards need the KPI and the story behind it. Staff may need the supporting metrics to manage the work.
What most nonprofits get wrong
The most common mistake is reporting too many numbers without connecting them to decisions. A metric is only useful if it helps leaders understand progress, risk, ownership, or the next action.
The second mistake is separating metrics from narrative. A board member or funder should not have to interpret raw dashboards. They need the number, the context, the owner, and the decision or follow-up.
How Elate helps nonprofits measure strategic plan progress
Elate helps nonprofits connect metrics to the strategic priorities, initiatives, and owners responsible for moving them. Teams can create scorecards, collect owner narrative, surface at-risk work, and generate board or funder-ready reporting views from the same information.
This creates a stronger reporting rhythm because metrics do not sit off to the side. They sit inside the plan, next to the work, ownership, risks, and updates that explain what the organization is doing about them.
Related resources
- Nonprofit Strategy Execution Software
- Nonprofit Board Report Template
- Nonprofit Operating Plan Template
- Grant Reporting for Nonprofits
- Nonprofit Operating Rhythm
FAQ
What metrics should nonprofits use to measure strategic plan progress?
Nonprofits should use outcome, program delivery, financial, capacity, risk, compliance, and execution metrics. The right mix depends on the strategic priorities and reporting audience.
How many strategic plan metrics should a nonprofit board review?
Most boards should see a focused set of strategic indicators, not every program measure. A useful board pack often highlights key outcomes, at-risk priorities, major funder commitments, and decisions needed.
What is the difference between nonprofit KPIs and program metrics?
KPIs are the measures leadership uses to judge progress against strategy. Program metrics explain operational activity and help teams manage the work behind the KPI.
How does Elate help nonprofits track strategic plan metrics?
Elate connects metrics to strategic priorities, initiatives, owners, narrative updates, risks, and reporting views so teams can explain progress instead of just showing numbers.