


Quick answer: A higher education strategic plan dashboard should show priority status, selected KPIs, owner accountability, narrative context, risks, and follow-ups so leaders can understand progress quickly and decide what needs attention.
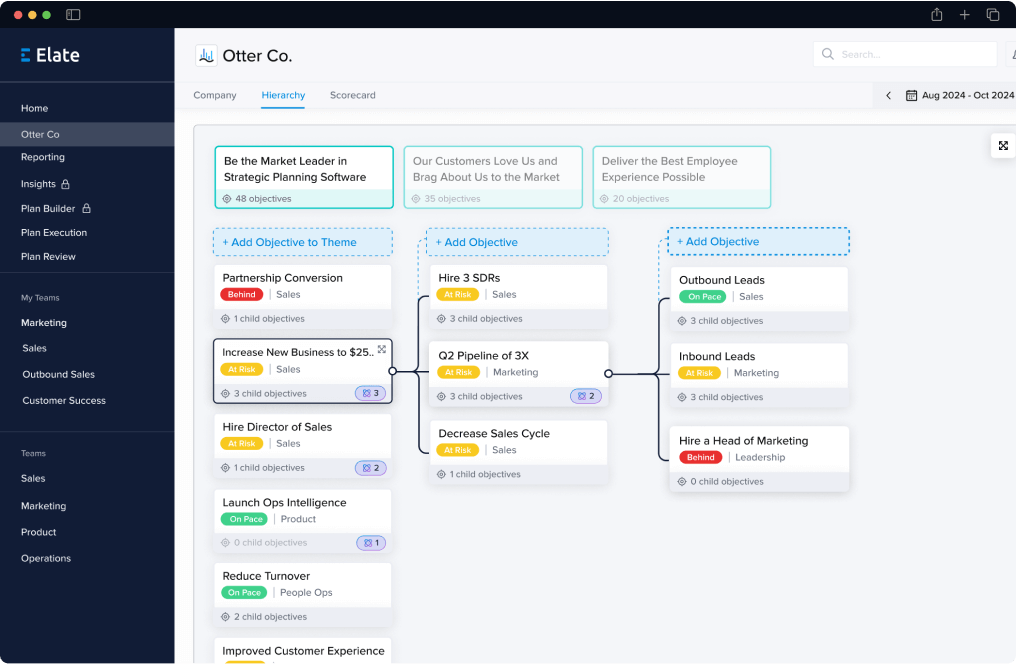
Where Elate fits: Elate helps higher education teams turn dashboards into a leadership operating view. Instead of showing metrics without ownership or context, Elate connects KPIs to priorities, owners, updates, risks, and reports so leadership can act on what the dashboard reveals.
Use this page if: your institution has dashboards, spreadsheets, or BI reports but still struggles to explain strategic plan progress to cabinet, trustees, institutional effectiveness, or initiative owners.
Higher education operating reality: Dashboards are useful when they create better review conversations. In higher education, the dashboard has to pair selected KPIs with owners, context, risk, and follow-up so cabinet, IE, and trustees can act on the signal.
What a higher education strategic plan dashboard should include
- Strategic priorities: the plan structure leadership recognizes.
- Status by priority: on track, at risk, off track, complete, or paused.
- Owner accountability: who owns each priority, initiative, or outcome.
- Selected KPIs: the metrics that actually help explain progress.
- Narrative context: what changed, why it changed, and what happens next.
- Risk and blocker visibility: what needs attention before the next review.
- Follow-up tracking: decisions and actions from the last leadership review.
Summer dashboard review: what to freeze, refresh, and carry forward
Summer is the right time to review whether the strategic plan dashboard is still useful. Before the next academic year begins, teams should decide which metrics to freeze for annual reporting, which measures to refresh for the next cycle, and which dashboard views should support cabinet or trustee reporting.
Use the summer dashboard review to ask:
- Which KPIs need a final snapshot for annual or fiscal-year reporting?
- Which measures still align to the current strategic priorities?
- Which metrics need clearer owners or source notes?
- Which dashboard views should inform cabinet, trustee, or IE reporting?
- Which at-risk priorities need narrative explanation, not just a red or yellow status?
Dashboard vs operating rhythm
A dashboard can show a number. It does not always show who owns the response, what action is underway, or what decision leadership needs to make. That is why many institutions have dashboards and still rebuild progress reports manually.
The dashboard should be part of a broader operating rhythm:
- Owners update progress.
- Selected KPIs are reviewed with narrative context.
- At-risk items become the meeting agenda.
- Follow-ups are assigned and carried into the next cycle.
- Cabinet or trustees receive a concise pre-read based on the same current information.
How Elate helps higher education teams use dashboards for action
Elate helps institutions connect dashboard metrics to the strategic plan, owner narrative, risk, and leadership reporting. BI tools can continue to provide data and visualization. Elate creates the review layer where the institution answers what changed, who owns it, what is at risk, and what should happen next.
This makes dashboards more useful because they become part of the leadership cadence instead of a separate place people check only when a report is due.
Related resources
- Summer Strategic Planning Checklist for Higher Education
- Fall Strategy Execution Launch Checklist for Colleges and Universities
- Cabinet Strategic Plan Update Template for Higher Education
- Community College Strategic Plan Progress Report Template
- Higher Education Strategy Execution Software
- Higher Ed Strategy Execution Playbook
- Higher Education Operating Guide
- Annual Strategic Plan Review Software for Higher Education
- Strategic Plan Roll-Forward Checklist for Higher Education
- Annual Strategic Plan Progress Report Template for University Trustees
- Higher Education Strategic Plan Reporting Software
- Institutional Effectiveness Strategic Plan Progress Software
- Higher Education Strategic Plan Dashboard
- Elate Platform
- Request a Product Demo
FAQ
What should a higher education strategic plan dashboard include?
It should include priorities, status, selected KPIs, owner updates, narrative context, risks, follow-ups, and reporting views for leadership review.
How are dashboards different from strategic plan reporting?
Dashboards show metrics and status. Strategic plan reporting connects those metrics to ownership, narrative, risk, decisions, and review cadence.
How should colleges review dashboards during summer planning?
They should freeze annual KPI snapshots, refresh measures for the next cycle, confirm metric owners, and decide which dashboard views support cabinet and trustee reporting.
How does Elate support higher education dashboards?
Elate connects dashboard metrics to priorities, owners, updates, risks, and reports so leaders can act on the information instead of only viewing it.